


Perfdog 
PerfDog-Client Performance Test Tool
Updated on: 2023-09-08 16:41Introduction:
A performance test and analysis tool platform for full mobile platform iOS/Android. Quickly address and analyze performance problems to improve APP and game performance & quality. Mobile phones need no ROOT / Jailbreak. Need no change of mobile phone’s hardware, games and APPs. Very simple and plug & play.
PerfDog supports the performance tests for all the APPs of the mobile platform (games, APPs, browsers, applets, mini-games, H5 and background system processes, etc.), Android emulators and real phone on cloud, etc. It supports the APP multi-process test (such as Android multi-subprocess and iOS extension process APP Extension).
The Windows & Mac OS X platform PerfDog desktop APP versions all support the test for both iOS and Android devices. PerfDog can be opened in multiple on PC and a single PC can test multiple mobile phones simultaneously.
Important notes Q&A: https://perfdog.wetest.net/article_detail?id=23&issue_id=0&plat_id=1
Special model guide:https://perfdog.wetest.net/article_detail?id=21&issue_id=0&plat_id=1
Description on performance reference standard:https://perfdog.wetest.net/article_detail?id=15&issue_id=0&plat_id=1
WEB manual:https://perfdog.wetest.net/article_detail?id=3&issue_id=0&plat_id=3
Windows device testing specification: https://perfdog.wetest.net/article_detail?id=142&issue_id=0&plat_id=1
Installation & operation:
Step 1: Log in PerfDog official website:https://perfdog.wetest.net, download the desktop APP according to your selected platform
Windows platform: extract the downloaded package and double click to open the PerfDog.exe desktop APP.
Mac platform: directly run dmg desktop APP.
Remark: PerfDog adopts the mode of free-installation software (green version). To update it, you just need to download the latest edition from the official website.
Step 2: connect mobile phone with USB. The mobile phone will be automatically detected and added into the APP list.
iOS: Plug & Play. The user needs no any operation. If PerfDog failed to detect the connected mobile phone or failed to test; please make sure that the latest iTunes can connect the mobile phone (can directly download and install the latest iTunes from QQguanjia).
Remark: if failing to use it, please refer to: https://perfdog.wetest.net/article_detail?id=23&issue_id=0&plat_id=1
Android: two modes are provided as installation mode and non-installation mode. (Note: please open the mobile phone USB debugging mode and allow installation and application via USB).
a. Non-installation mode:
The mobile phone is plug&play, needs no setting up or installation and is very easy to use. But there is no real-time performance data display on the mobile phone screen.
a. Installation mode:
Needs to automatically install PerfDog.apk on the mobile phone. There is real-time performance data displayed on the mobile phone screen (permissions to install and apply via USB and PerfDog floating window management). If you start the PC-version PerfDog.exe, PerfDog.apk will be PUSH installed automatically on the mobile phone. The specific installation is similar to the installation of third-party APPs onto various mobile phone makes. (Note: because many mobile phones need an account and password to install, it will result in failure for automatic installation. If the automatic installation fails, the installation file PerfDog.apk will be released into the current folder and you just need to manually install PerfDog.apk). In this mode, during the test, the PerfDog display app may be killed due to system resource shortage (performance data display on mobile phone interface), but it will not influence the normal test function.
Remark: if failing to use it, please refer to: https://perfdog.wetest.net/article_detail?id=23&issue_id=0&plat_id=1
Step 3: test mode
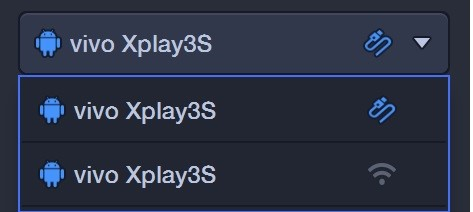
- USB mode test:
Once it is connected via USB, select the USB icon device in the device list to run USB mode test
- Wi-Fi mode test (test power):
In Wi-Fi mode, only the information such as power can be tested. Once it is connected via USB, select the Wi-Fi icon device in the device list to run Wi-Fi mode test. After Wi-Fi detects the connection is successful, unplug the USB connecting line. (Note: needs to connect PC and test mobile phone to the same Wi-Fi. After Wi-Fi detects the connection is successful, unplug the USB cable of the tested mobile phone (it will make no sense to test the power in USB mode because it will charge the phone) (remark: usually a company limits it with a safety policy, which results in the iOS platform not operating in such Wi-Fi).
Step 4: select the game & APP to test
PC as shown in the figure:
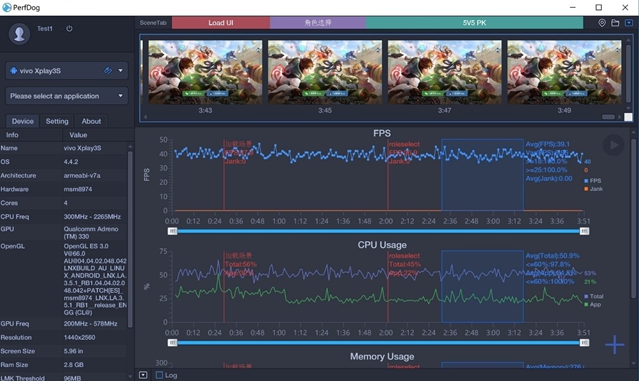
For Android platform, in the installation mode, there is real-time performance data display on the upper left
corner of the mobile phone screen (for Android mobile phones, please open the
PerfDog floating window management permission. Otherwise, the performance
parameters will not be displayed on the mobile phone)

Collection of software performance data:
iOS platform (Apple official Xcode tool parameters alignment. Note: the iOS system has strict limitations on the process performance parameters. If going beyond the limitation, it will be killed by the system)
- ScreenShot (only supports USB mode. Note: for some models, to take screenshot will influence the performance)
- FPS (real average refresh times of game screen or application interface within 1 second, commonly known as frame rate/FPS)
1) Avg(FPS): Average FPS (the average FPS within a period)
2) Var(FPS): FPS variance (FPS variance within a period)
3) Drop(FPS): number of frame drops (average times of dropping adjacent two FPS points being more than eight frames within 1 hour)
4) Std (FPS): Standard deviation of frame rate (FPS standard deviation in a period of time)
- Jank (number of Janks within 1s. It does not support iOS9.1 or lower system. Similar to the statistics principles of Androids’ Jank and iOS’s FramePacing smoothness. A high FPS does not meant fluency or no Jank. For example, if FPS is 50 frames and one frame is rendered in the first 200ms and 49 frames are rendered in the remaining 800ms. Although FPS is 50, the process still gives a feeling of many Janks. Also, a low FPS does not mean Jank. For example, an even FPS with no Jank is 15 frames. Therefore, the average FPS has no direct relation with Jank)
Reference:https://perfdog.wetest.net/article_detail?id=20&issue_id=0&plat_id=1
PerfDog Jank calculation method:
1. If the two conditions below are both met, it will be regarded as one Jank.
a) Current FrameTime > Twice the average time of the previous three frames.
b) Current FrameTime > Time of two movie frames (1000ms/24*2≈84ms).
2. If two conditions are both met, it will be regarded as a Big Jank.
a) Current FrameTime > Twice the average time of the previous three frames.
b) Current FrameTime > Time of three movie frames (1000ms/24*3≈125ms).
1) BigJank: times of serious Jank within 1s
2) Jank (/10min): average number of Janks within 10min.
3) BigJank(/10min): average number of serious Janks within 10min.
SmallJank ( Capturing small caton based on Jank)
Smooth (Frame stability index, which can evaluate the stability of game or application screen, general game and video suggestions < 8, application app (sliding) suggestions < 20)
- Stutter (the proportion of Jank time during testing.)
- FTime (Display time interval between two adjacent frames, i.e. FrameTime, iOS9.1 or lower systems are not supported).
1) Avg(FTime): Average FrameTime
2) Delta(FTime): Incremental time (average time when the time interval between two adjacent frames is within 1 hour > 100ms)
3) Var(FTime): Variance of frame time
4) Std(FTime): Standard deviation of frame time
- CPU Usage(TotalCPU indicates the total CPU usage and AppCPU indicates the process CPU usage. The statistics result is consistent with Xcode. PerfDog usage =Xcode usage / number of cores. Remark: the CPU Usage of iOS platform is a non-normalized CPU usage. Please refer to https://perfdog.wetest.net/article_detail?id=12&issue_id=0&plat_id=1)
- Memory (is the statistics of FootPrint. Note: OOM is related to FootPrint and is irrelevant with the system and model. It is only related to RAM, such as 1G-memory machine. If FootPrint exceeds 650MB, it will cause OOM). Note: PerfDog is unable to acquire in iOS9 and 10 systems now. But other versions are OK. They will add PerfDog later. To run a performance test, it is recommended to upgrade iOS system version.
- Xcode Memory (XCode Debug gauges statistics method, i.e. XCode Memory). Note: unable to acquire in iOS9 and 10 systems now. But other versions are OK. They will add PerfDog later. To run a performance test, it is recommended to upgrade iOS system version.
- Real Memory(Xcode Instrument statistics method, i.e. Real Memory, actually occupied physical memory. Note: it depends on the system policy of physical memory. It is not cared about to when measuring memory metrics but is helpful to analyze and address the problem of overall performance. For example, if the footprint is not reduced, it indicates that the APP does not release the memory. But if the real memory decreases, it will indicate the system compressed the memory. Because the compression will occupy CPU resource and also cause FPS to decline accordingly)
- Virtual Memory
- Available Memory
- Wakeups (Note: a process exceeding 150 tends to be killed by the system. A sleep/wake cycle on each thread per second, exceeding limit of 150 wakeups per second over 300 seconds, especially the event where iOS13.2 kills the background process. It is recommended to pay close attention)
- CSwitch (context switch test. Note: for a single core, a process exceeding 14000 tends to be killed by the system. Context Switch Limit 14000(Core/Second)
- GPU Utilization
1) Render: renderer usage (in the pixel shading processing stage, if its proportion is high, it indicates that a bottleneck appears in the PS stage because the shader is too complex or texture size and complex sampling, etc.)
2) Tiler: Tiler usage (in the vertex shading processing stage, if its proportion is high, it indicates that a bottleneck appears in the VS stage because the vertex count is too high, etc.)
3) Device: device usage (overall GPU usage)
- GPU Counter(only USB mode)
support all ios GPU Counter, same as Instrument
iOS GPU Counter data description: https://perfdog.wetest.net/article_detail?id=140&issue_id=0&plat_id=1
iOS GPU Counter compatibility list: https://perfdog.wetest.net/article_detail?id=141&issue_id=6&plat_id=1
- Network(Recv/Send, process flow of test target, the statistics result is consistent with Xcode) (note: app is tested in USB test mode and machine or app may be tested in Wi-Fi test mode)
- BTemp (battery temperature)
- Battery Power (only Wi-Fi mode, machine real-time Current, Voltage, and Power consumption) (note: acquire once every 20s. It is the most accurate statistics method so far. The result is consistent with the result of Battery life. It supports all iOS models)
Note: Sum(Battery) is power consumption.
- Energy Usage (i.e. Xcode Energy Impact. Monitor the power consumption of APPs (including CPU, GPU, Network, Location, Display (iPhone X only), Overhead). (Note: consistent with the result of Xcode Energy Impact. Test in wired mode and support iOS9 or higher system. Total Energy<=270 is Low, 270<Total Energy<=1000 is High, Total Energy>1000 is Very High).
Reference: https://help.apple.com/xcode/mac/11.0/index.html?localePath=en.lproj#/devf7f7c5fcd
- Log collection (does not support Log collection in Wi-Fi mode)
Android platform
- ScreenShot (only supports USB mode. Note: for some models, to take screenshot will influence the performance)
- FPS (real average refresh times of game screen or application interface within 1 second, commonly known as frame rate/ FPS)
1) Avg(FPS): Average FPS (the average FPS within a period)
2) Var(FPS): FPS variance (FPS variance within a period)
3) Drop(FPS): number of frame drops (average times of dropping adjacent two FPS points being more than eight frames within 1 hour)
4) Std (FPS): Standard deviation of frame rate (FPS standard deviation in a period of time)
Remark: High-order FPS functions – Android window and FPS
Please refer to : https://perfdog.wetest.net/article_detail?id=10&issue_id=0&plat_id=1
- InterFrame (some models use the dynamic interpolation technique. This parameter can really reflect the number of frames interpolated in 1s)
- Jank (number of Janks within 1s. The explanations are as those of iOS)
1) BigJank: times of serious Jank within 1s
2) Jank (/10min): average number of Janks within 10min.
3) BigJank(/10min): average number of serious Janks within 10min.
SmallJank ( Capturing small caton based on Jank)
Smooth (Frame stability index, which can evaluate the stability of game or application screen, general game and video suggestions < 8, application app (sliding) suggestions < 20)
- Stutter (the proportion of Jank time during testing.)
- FTime (Display time interval between two adjacent frames, i.e. FrameTime).
1) Avg(FTime): Average FrameTime
2) Delta(FTime): Incremental time (average time when the time interval between two adjacent frames is within 1 hour > 100ms)
3) Var(FTime): Variance of frame time
4) Std(FTime): Standard deviation of frame time
- CPU Usage (conventional CPU usage, also referred to as non-normalized CPU usage. TotalCPU denotes the total non-normalized CPU usage. AppCPU denotes the process non-normalized CPU usage. Remark: the statistics result is consistent with Android Studio Profiler Refer to https://perfdog.wetest.net/article_detail?id=12&issue_id=0&plat_id=1 for the details)
- CPU Usage (Normalized) (normalized CPU usage, TotalCPU denotes the total normalized CPU usage. AppCPU denotes the process normalized CPU usage. Remark: it is recommended to use the normalized CPU usage because it is more accurate for performance reference. Refer to https://perfdog.wetest.net/article_detail?id=12&issue_id=0&plat_id=1 for the details)
- CPU Clock (non-normalized frequency and non-normalized usage of each CPU core)
- Memory (PSS Memory, the statistics result is consistent with Android Java API standard result and also consistent with Meminfo. Note: for some Samsung models, the systems have modified the Meminfo underlying statistics method, causing the statistics for Meminfor and Java AP to be inconsistent. The new Samsung models have corrected this)
- Swap Memory (Swap Memory, some devices support the Swap function. After Swap function is enabled, the system will compress PSS memory, then Swap will increase and PSS will decrease accordingly because the compression will occupy CPU resource and accordingly cause FPS to decrease)
- Virtual Memory(VSS)
- Available Memory
- Memory Detail(NativePss、Gfx、GL、Unknown、Dalvik Heap、Dalvik Other、Stack、Cursor、Ashmem、Other dev、.so mmap、.jar mmap、.apk mmap、.ttf mmap、.dex mmap、code mmap、image mmap、Other mmap、Graphics、Memtrack、.oat mmap、.art mmap、EGL mtrack、Other mtrack)
Note: in an extreme condition, for example, if the game’s super-high FPS is enabled, it is recommended not to tick collect Memory Usage and Memory Detail because some models will suffer performance loss.
- GPU Usage (supports only some mobile phones so far). Note: Top Android GPU test models; please refer to: https://perfdog.wetest.net/article_detail?id=17&issue_id=0&plat_id=1
- GPU Frequency (supports only some mobile phones so far).
- GPU Counter support by different artictecture:
support all Qualcomm GPU Counter,same with Snapdragon
support all Mali GPU Counter,same with Streamline
support part of PowerVR GPU Counter,same with PVRTune
- Mali GPU Utilization (support only Mali chip GPU) Note: for the supported GPU list, please refer to: https://perfdog.wetest.net/article_detail?id=16&issue_id=0&plat_id=1
1) Non-fragment: the ratio of the GPU time consumed by the non-fragment shader (vertex shader, subdivision shader, compute shader) in the GPU time consumed by rendering.
2) Fragment: the ratio of the GPU time consumed by the fragment shader in the GPU time consumed by rendering.
- Mali Memory & Bus Bandwidth (support only Mali chip GPU)
1) L2Load/Store: Actual bandwidth that Load/Store unit reads L2 memory (including vertex cache, atom and image data).
2) L2Texture: Actual bandwidth that texture unit reads L2 memory (texture sampling).
3) Bus Read: defines the actual read bandwidth from GPU to DRAM or to the system memory outside GPU.
4) Bus Write: defines the actual write bandwidth from GPU to DRAM or to the system memory outside GPU.
- Mali Pixels Info (support only Mali chip GPU)
1) OverDraw: indicates how many segments and layers each pixel consists of. It is usually used to express the times that a pixel is drawn repeatedly.
2) PixelsThroughput: indicates the number of clocks of GPU consumed by each rendered pixel.
Note: for more description of GPU information, please refer to: https://perfdog.wetest.net/article_detail?id=19&issue_id=0&plat_id=1
- Network (Recv/Send, process flow of test target,) (Note: is APP data in both USB and Wi-Fi modes)
CTemp (CPU temperature)
GTemp (GPU temperature)
BTemp (Battery temperature)
NTemp (NPU temperature)
- Battery Power (only Wi-Fi mode, Current, Voltage, Power consumption) (Note: test error is < about 3% compared with instrument). Note 1: Sum(Battery) is power consumption. Note 2: for the compatible dual-motor type, please refer to https://perfdog.wetest.net/article_detail?id=7&issue_id=0&plat_id=1. For the incompatible device, the current can be x2 to tolerate the fault.
FPower (Frame power consumption)
- Log collection (does not support Log collection in Wi-Fi mode)
Web performance data management:
- Account information management
- Performance data management, chart display, edit, large version comparison
- Performance data statistics, analysis and multi-dimension comparison, etc.
- Performance test mask management
Software function introduction:
1. Performance parameter control Page:
Click
“+” button, select the performance parameter necessary to collect and control
the performance parameter display page

2. Record storage:

After the test ends, you can independently choose two methods to save or process (Upload/Save) performance data:
1) Upload the performance data synchronously to PerfDog cloud web Kanan


2) Locally export Excel file

3. Play back record (convenient for lookback analysis):
Open the file to play back

The playback result is as shown in the figure:

4. Annotation and calibration (left double click the mouse to annotate. Left double click the generated annotation to cancel it. Left single click to calibrate):

5. Set the performance parameter statistics & analysis threshold, edit the statistics parameter analysis and select the record to save (comparing with TDR standard):
Can use mouse to select/drag, query the time and cycle, statistics data, etc. Also, can save the selected data. Can set the corresponding performance parameter statistics analysis threshold, etc., on the right.

6. Scene Label:
Make a label of the performance data using the label button. Left double click the mouse on the color area to modify the corresponding area label name

7. Screen record:
Note: screenshot record is enabled which influences the performance
8. Multi-process test.
iOS platform: APP multi-process is divided into APP Extension and system XPC Server.
For example: an E-sports live broadcasting software uses APP Extension process (Extension process name: LABroadcastUpload). Of course, the system XPC Server process may also be used, for example, the web browser usually uses webkit.
Android platform: usually the large APPs, such as games, can sometimes operate collaboratively in multiple processes (APPs such as WeChat Mini Game and Weishi, etc., as well as games such as Honor of Kings all use multiple processes). Can select the target subprocess to perform the target test. It is the host process by default. Honor of Kings is as shown in the figure.
How Android tests WeChat Mini Game & Mini Program: https://perfdog.wetest.net/article_detail?id=4&issue_id=0&plat_id=4
How iOS tests WeChat Mini Game & Mini Program: https://perfdog.wetest.net/article_detail?id=127&issue_id=0&plat_id=4

Testing Mini Game, Mini Program, etc. Below is Mini Game – Romantic Rose Garden

Remark: the subprocess name is highlighted, indicating that the current subprocess is at the top.
9. FPS high-order functions (Android platform):
Meet the requirements of senior users to more precisely test the window FPS (suitable to all APPs including games, Mini Games, Applets, live broadcasting, videos and web, etc.)
Please refer to: https://perfdog.wetest.net/article_detail?id=10&issue_id=0&plat_id=1
10. Log functions:
Collect the system log information.

11. Stop function:
No need to unplug the mobile phone. Click the 'Stop Test' button to stop collecting data.

12. Customize data file server address to create your own web cloud:
The data file server can be modified to upload the address. Post uploads http protocol format file to your own server address.

Reference and Demo: https://perfdog.wetest.net/article_detail?id=18&issue_id=0&plat_id=1
13. Sidebar Collapse: Click here to collapse the panel to collapse the left information bar

14. MemReport feature(Supports Dev version of Unreal engine): click the "MemReport" button in the upper right corner to get the current time point MemReport data

Click the MemReport tab to bring up the MemReport dialog

MemReport report style:


Introduction of Web cloud platform:
1. Personal performance data MyData.

Display of specific performance data.

2. Test mask management
Create a task and invite the test member to join or join the test task created by others.

3. Performance data sharing & summarization

4. Test task performance data Task Data

5. Data report & privacy sharing

Access the link shared by others to view the data report:
https://perfdog.qq.com/case_detail/367665 Password: xs2BPa
6. Multi-dimension comparison of case report (details, model, version, ratio, interval, tendency, drag & zoom, etc.)

Comparison of ratio, interval, tendency and drag & zoom, etc. (drag the performance curve left or right with the mouse)
