

 Previous: Customize data file server address Next: List of supported Android GPU
 For the mobile performance test, the CPU and GPU usages of mobile phones are always a concern of people. Especially, the GPU running status in the game performance test being the focus more concerned. This time, the PerfDog gets to support collecting the detailed GPU information for the first time in the industry (supporting Mali machine in Phase 1). Compared with only the GPU usage and GPU frequency that could be recorded before, the new version of PerfDog adds the information including Mali GPU Utilization, Mali Pixels Info, and Mali Memory & Bus Bandwidth. It displays all the detailed information of the GPU running to provide more substantial data support for both targeted optimization of game GPU and game performance evaluation.
Below we will systematically explain the meaning of various newly added GPU performance indices as well as how to use these indices to analyze and optimize the GPU performance.
Meaning of performance indices
Mali GPU Utilization includes two performance indices of Non Fragment Utilization and Fragment Utilization. The Non Fragment Utilization refers to the percentage of the non-fragment processing time in the total GPU processing time. The Fragment Utilization refers to the percentage of the fragment processing time in the total GPU processing time.
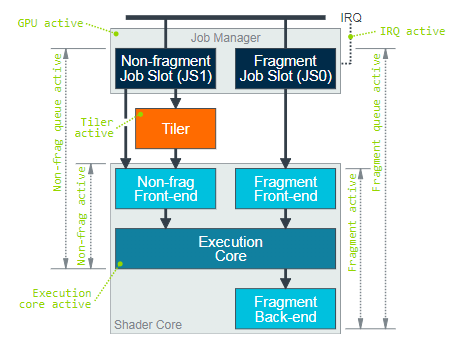
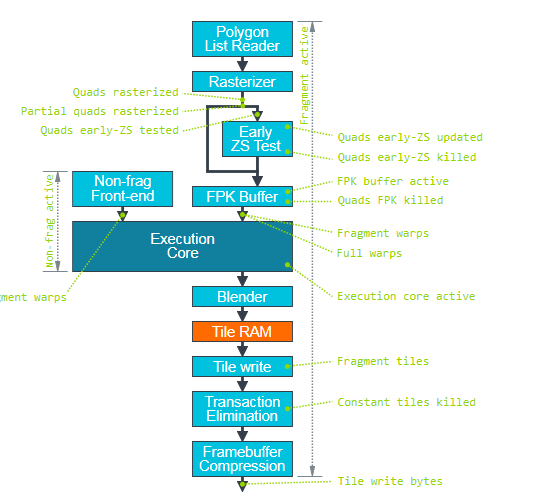
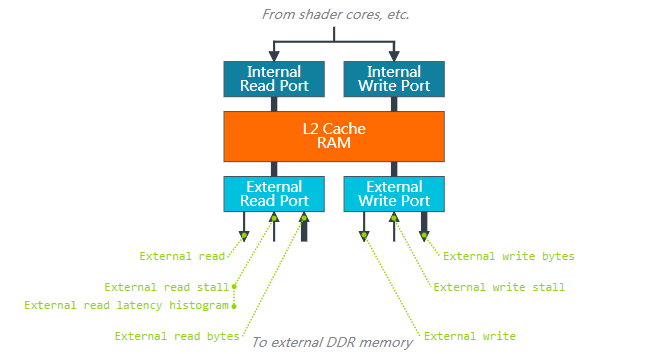
The figure above displays the basic processing pipeline data paths to process various types of workloads by GPU as well as the performance indices of each processing module in every hierarchical structure. The workloads run on Mali GPU are coordinated by the job manager. This job manager is responsible for scheduling the workloads to each processing unit inside the GPU. It opens two FIFO work queues (referred to as job slots) to the graphics drive program. One slot is used for the Non Fragment workloads including vertex shading, tiling, geometry shading, tessellation shading and compute shading. Another slot is used for the Fragment shading workloads which mainly include rasterization, EarlyZ, FPK, Fragment shading, Blender and Tile write, etc.
It is used to address whether the GPU bottleneck is in Non Fragment processing phase or Fragment processing phase and can be used to guide the direction of program optimization. In case of GPU bottleneck, normally at least Non Fragment Utilization or Fragment Utilization will approach 100%. If both of them are lower than 100%, it is possible that there is a data dependency relation between Non Fragment and Fragment.
Reasons for too high Non Fragment Utilization and suggestions for optimization:
1. Too many vertices
1.1 Whether there are lots of invisible vertices. Suggestions for optimization: Occlusion Culling, Frustum Culling and Back Culling.
1.2 Many visible vertices. Suggestions for optimization: use Lod simplified model and Distance Culling.
2. Lots of vertex attribute data. Suggestions for optimization: use the medium-precision attributes and delete the useless attributes.
3. Too complex Vertex Shader. Suggestions for optimization: prevent sampling texture in Vertex Shader and try to use low-precision variables to perform calculation.
4. Use complex computer shader or geometry shader, tessellation shader
Reasons for too high Fragment Utilization and suggestions for optimization:
1. Too many fragments
1.1 Usage of Mask material resulting in failure of EarlyZ and FKP mechanisms. Suggestions for optimization: render Mask mesh depth or reduce Mask mesh facet count in advance. Check whether Mask can be disabled.
1.2 Too translucent pixels such as particles. Suggestions for optimization: reduce particle quantity and control particle size.
2. Too complex fragment Shader
2.1 ALU logic calculation consumes long time. Suggestions for optimization: avoid dynamic branching. Avoid using long time-consuming function and transfer complex calculation to VS stage.
2.2 Texture sampling consumes long time. Suggestions for optimization: reduce texture sampling times, use compressed format texture and avoid using anisotropic filtering method.
2.3 Load/Store consumes long time. Suggestions for optimization: use medium-precision variables and try to avoid using high-precision calculation.
Refers to the GPU Cycle averagely consumed by each shaded Pixel, including Non Fragment processing Cycle and Fragment processing Cycle. Assuming that the GPU maximum frequency is 800MHz, the GPU usage is 100%, the game running resolution is 1080*2340 and FPS is 60, then
Shaded Pixel per second (considering no OverDraw) = 1080 * 2340 * 60 = 151.6M
PixelThrought = 800M / 151.6 = 5.27 Cycle
It indicates that it takes 5.27 Cycles averagely to render each Pixel in the circumstances.
Because this index measures the GPU Cycle averagely consumed by each shaded Pixel, this index is usually related with the complexity of Vertex Shader or Fragment Shader. The two indices of Non Fragment Utilization and Fragment Utilization can be based to determine which part is the bottleneck. If Fragment is the processing bottleneck, it indicates that Fragment Shader under current scene is complex which results in long Cycle consumed to process a single Pixel.
Test cases: keeping the vertex count and Fragment quantity unchanged, use loop statement and times to control the calculated amount of VS and FS so as to verify the influence on PixelThroughput.
Test model: Oppo R15 (GPU model: Mali G72 MP3)
Test data:
VS LoopNum | FS LoopNum | PixelThroughput(cycles) |
0 | 0 | 0.1 |
100 | 0 | 1.7 |
0 | 100 | 3.8 |
100 | 100 | 4.3 |
Test conclusion: the higher the cycle number in Shader, the larger the calculated amount and the higher the PixelThroughput.
Overdraw is the number of times that the same pixel is drawn repeatedly in one frame. The OverDraw in PerfDog is the average OverDraw per second, i.e.
OverDraw = Shaded Fragments per second / Screen Pixels per second
Assuming that the game running FPS is 60, the game running resolution is 1080*2340 and the number of Shaded Fragments per second is 273M, then OverDraw = 273*1000000 / (1080*2340*60) = 1.8
From the equation above, it can be found that with a fixed resolution and frame rate, the higher the OverDraw, the larger the number of the processed Fragments of each frame and the higher the load. Once the load exceeds the GPU’s maximum processing capacity, it will cause dropped frame rate.
When we analyze GPU performance, it needs to first address the performance bottleneck. If Fragment Utilization rises suddenly in a certain period, it may be from the following two reasons:
1. Fragment quantity increases, thus the corresponding Overdraw performance indices rise. The optimization direction is to reduce OverDraw.
2. Average time consumed to process Fragment increases, thus the corresponding PixelThrought performance indices rise. The optimization direction is to reduce the complexity of material Shader.
Reasons for too high Overdraw and suggestions for optimization:
1. Too high Overdraw in the game is mainly due to the AlphaTest and AlphaBlend object rendering. Because the EarlyZ and FPK mechanisms in the GPU will automatically sort and cull the shaded fragments, the Opaque object has less effect on OverDraw.
2. Effect on Overdraw from AlphaTest object: only after FragmenShader is executed can it be determined as to whether to write the depth of AlphaTest object or not. The delayed depth writing will affect the HSR efficiency under the TBDR architecture because the subsequent pixels can only be processed further after the AlphaTest pixel finishes executing FragmenShader and updates the depth buffer area.
Suggestions for optimization of Overdraw by AlphaTest object:
1. Render in the order from front to back.
2. Reduce AlphaTest triangular pixel area when producing arts
Effect on Overdraw from AlphaBlend object: AlphaBlend object can be applied with EarlyZ culling by Opaque object. However, AlphaBlend triangles cannot be applied each other with EarlyZ culling because it cannot write depth, thus generating OverDraw during overlay. The translucent particle effects and UI, etc., in the game tend to produce an OverDraw problem.
Suggestions for optimization of Overdraw by AlphaBlend object
1. Decrease the number of translucent blending and overlay layers, such as the translucent particle effect which adjusts the particle quantity according to the model.
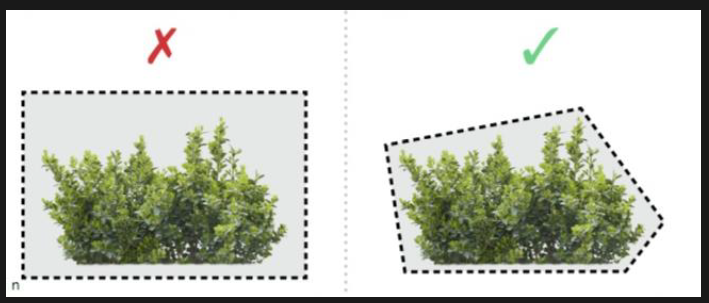
2. Try to reduce the screen rendering area of the translucent pixel. For example, using the irregular facets to replace the rectangular facets for rendering when rendering particle effect or UI.
Test case 1: verify the effect on OverDraw from AlphaBlend object overlay and rendering
Start from the camera to draw a full-screen quad from near to far. Use the slider to control N layers (totally 20 layers, 0<N<=20) near the camera to be a translucent full-screen quad and the latter (20-N) layers to be opaque full-screen quad, so as to verify whether the value of Fragments/pixel satisfies the definition of OverDraw.
Test model: Oppo R15 (GPU model: Mali G72 MP3)
Test data:
Number of opaque layers | Number of translucent layers | OverDraw |
20 | 0 | 1 |
19 | 1 | 2 |
10 | 10 | 10.9 |
20 | 20 | 19.8 |
Test conclusion: because GPU is designed with EarlyZ and FKP mechanisms, the shaded opaque triangles are culled. Thus, the shaded opaque triangles will not increase OverDraw. However, because the uppermost translucent triangle cannot write depth, the upper layer of opaque triangle will not shade the lower layer of opaque triangle and will increase OverDraw, resulting in OverDraw not being proportional to the number of opaque triangle layers.
Test case 2: verify the effect on OverDraw from AlphaTest object rendering & sorting mode
Place 50 2D bulletin board grasses in the scene. Then adjust the rendering and sorting mode of the grasses and test OverDraw.
Test model: Oppo R15 (GPU model: Mali G72 MP3)
Test data:
Rendering & sorting method | Drawing from front to back | Drawing from back to front | Drawing in random order |
OverDraw | 24.6 | 32.3 | 26.9 |
The BusRead/BusWrite respectively denotes the number of bytes read from and written into the external shared memory per second by the GPU via system bus. It is very power consuming for the GPU to read from and write to an external DDR memory. Generally, the power consumption every GB/s bandwidth is 100mW. In addition, compared with the internal Cache inside the GPU, the latency will be longer to read from and write to an external memory.
The BusRead bandwidth is mainly provided by three processing units of Load/Store Unit, Texture Unit and Tile Unit of GPU. They are used to read the vertex input attribute data, Uniform data, TileList data, texture data, color/depth data. The BusRead size depends on the data amount per second read by those units of the GPU as well as the hit rate of L1 and L2 caches. Under the condition that the total data amount is unchanged, the higher the cache hit rate, the smaller the BusRead.
The BusWrite bandwidth is mainly provided by two processing units of Load/Store Unit and Tile Unit of the GPU. They are used to save the vertex output attribute data, TileList data and color/depth data.
Reasons for too high BusRead bandwidth and suggestions for optimization:
1. Vertex attribute bandwidth
1.1 Reduce vertex count: use Occlusion Culling, Frustum Culling and Distance Culling, Lod.
1.2 Vertex Position Attributes use a separate buffer area and the other attributes use another buffer area.
1.3 Remove the vertex input attribute data to not be calculated in Vertex Shader.
1.4. Try to use medium-precision attributes.
2. Texture bandwidth
2.1 Use compressed format such as ETC2, ASTC.
2.2 Using MipMap can increase Cache hit rate and decrease bandwidth.
2.3 Avoid using anisotropic filtering method.
2.4 Adjacent pixel texture coordinates should be continuous as much as possible to prevent jump and influencing Cache hit rate.
3. Color/depth buffer bandwidth
3.1 When rendering shadow, Framebuffer only binds the depth buffer area and the color buffer area is disabled.
3.2 Post-processing RT only binds the color buffer area and the depth buffer area is disabled.
3.3 At the beginning of each frame, call the glClear function to clear color, depth and template buffers to prevent reloading the Framebuffer data of last frame.
3.4 Avoid calling the functions such as glReadPixels to get pixels from Framebuffer.
Reasons for too high BusWrite bandwidth and suggestions for optimization:
1. Vertex output attribute bandwidth
1.1 Reduce vertex count: use Occlusion Culling, Frustum Culling and Distance Culling, Lod.
1.2 Try to use medium-precision output attributes.
2. Tile List bandwidth
2.1 Decrease quantity of triangles, especially the micro triangles. Can cull them according to ScreenSize.
2.2 Check whether to enable Back Culling.
3. Color/depth buffer bandwidth
3.1 When rendering shadow, Framebuffer only binds the depth buffer area and the color buffer area is disabled.
3.2 Post-processing RT only binds the color buffer area and the depth buffer area is disabled.
3.3 For every framebuffer, the bonding is only performed once and before unbinding or using the result of framebuffer object; make sure all the rendering instructions that will influence it are submitted completely.
Test case 1: verify the effect from the format of FrameBuffer color buffer area on memory bandwidth
Render one full-screen quad and only modify the format of the color buffer area to verify the effect on memory bandwidth.
Test model: Oppo R15 (GPU model: Mali G72 MP3)
Test data:
FBO additional texture Internal format | Average Frame rate | L2LoadStore (MB/s) | L2Texture (MB/s) | BusRead (MB/s) | BusWrite (MB/s) |
RGB565 | 59.7 | 0.0 | 88.2 | 127.8 | 2 |
RGB24 | 59.7 | 0.0 | 88.4 | 166.7 | 2.8 |
Test conclusion: the 24-bit format is used in the color buffer area. Compared with the 16-bit format, both BusRead and BusWrite bandwidth are increased obviously, a rise by 24% for BusRead and 28% for BusWrite.
Ø Test case 2: verify whether FrameBuffer will append the effect of depth buffer area on memory bandwidth
Render one full-screen quad and only modify whether to append the depth buffer area to verify the effect on memory bandwidth.
Test model: Oppo R15 (GPU model: Mali G72 MP3)
Test data:
Whether to append depth buffer area | Average Frame rate | L2LoadStore (MB/s) | L2Texture (MB/s) | BusRead (MB/s) | BusWrite (MB/s) |
No | 59.7 | 0.0 | 88.4 | 143 | 173 |
Yes | 59.7 | 0.0 | 86.4 | 174 | 190 |
Test conclusion: compared with no depth buffer area appended, both BusRead and BusWrite bandwidth are increased because the appended depth buffer area realizes the depth reading and writing
Test case 3: verify the effect of texture filtering method on memory bandwidth
Render one full-screen quad and only modify the texture filtering method to verify the effect on memory bandwidth.
Test model: Oppo R15 (GPU model: Mali G72 MP3)
Test data:
Texture Type | Average Frame rate | Filtering method | L2LoadStore (MB/s) | L2Texture (MB/s) | BusRead (MB/s) | BusWrite (MB/s) |
GL_Texture2D | 59.7 | Nearest | 0.0 | 64.8 | 132.2 | 0.7 |
GL_Texture2D | 59.7 | Bilinearity | 0.0 | 73.6 | 135.0 | 0.8 |
GL_Texture2D | 59.6 | Trilinearity | 0.0 | 94.7 | 162.2 | 0.8 |
Test conclusion: because the trilinearity needs to sample two MipMap, both L2Texture bandwidth and BusRead bandwidth are increased.
Previous: Customize data file server address Next: List of supported Android GPU